11.2. Using snapshot UI to make MC
When the model contains a lot of elements and parameters it becomes inconvenient to create multiple copies of the model. A snapshot UI may be used to save the state of any output. It uses Snapshot transformation. An example from the Fitting to Asimov dataset may be simplified as follows:
 1./gna \
 2      -- gaussianpeak --name peak  --nbins 50 \
 3      -- ns --name peak --print \
 4            --set E0             values=2    free \
 5            --set Width          values=0.5  free \
 6            --set Mu             values=2000 free \
 7            --set BackgroundRate values=1000 free \
 8      -- snapshot peak/spectrum peak/spectrum_MC --label 'Asimov MC' \
 9      -- dataset  --name peak --asimov-data peak/spectrum peak/spectrum_MC \
10      -- analysis --name analysis --datasets peak \
11      -- chi2 stats_chi2 analysis \
12      -- minimizer min minuit stats_chi2 peak \
13      -- ns --name peak --print \
14            --set E0             value=3   \
15            --set Width          value=0.2 \
16            --set Mu             value=100  \
17            --set BackgroundRate value=2000 \
18      -- spectrum -p peak/spectrum_MC -l 'Asimov MC' --plot-type errorbar \
19      -- spectrum -p peak/spectrum -l 'Model (initial)' \
20      -- graphviz peak/spectrum -o output/fit_02_graph.pdf \
21      -- fit min -s -p -o output/fit_02.yaml \
22      -- ns --print peak \
23      -- spectrum -p peak/spectrum -l 'Best fit' \
24      -- mpl --xlabel 'Energy, MeV' --ylabel entries --grid \
25             -o output/fit_02.pdf -s
The second model is replaced by the frozen copy of the original model. Snapshot UI takes at least two arguments: the output to read and the output to create. In current case the model from peak/spectrum is copied to the peak/spectrum_MC and frozen. The outputs remain bound though, so peak/spectrum_MC may be updated based on the new state of the peak/spectrum manually.
The fit produces identical result as the previous:
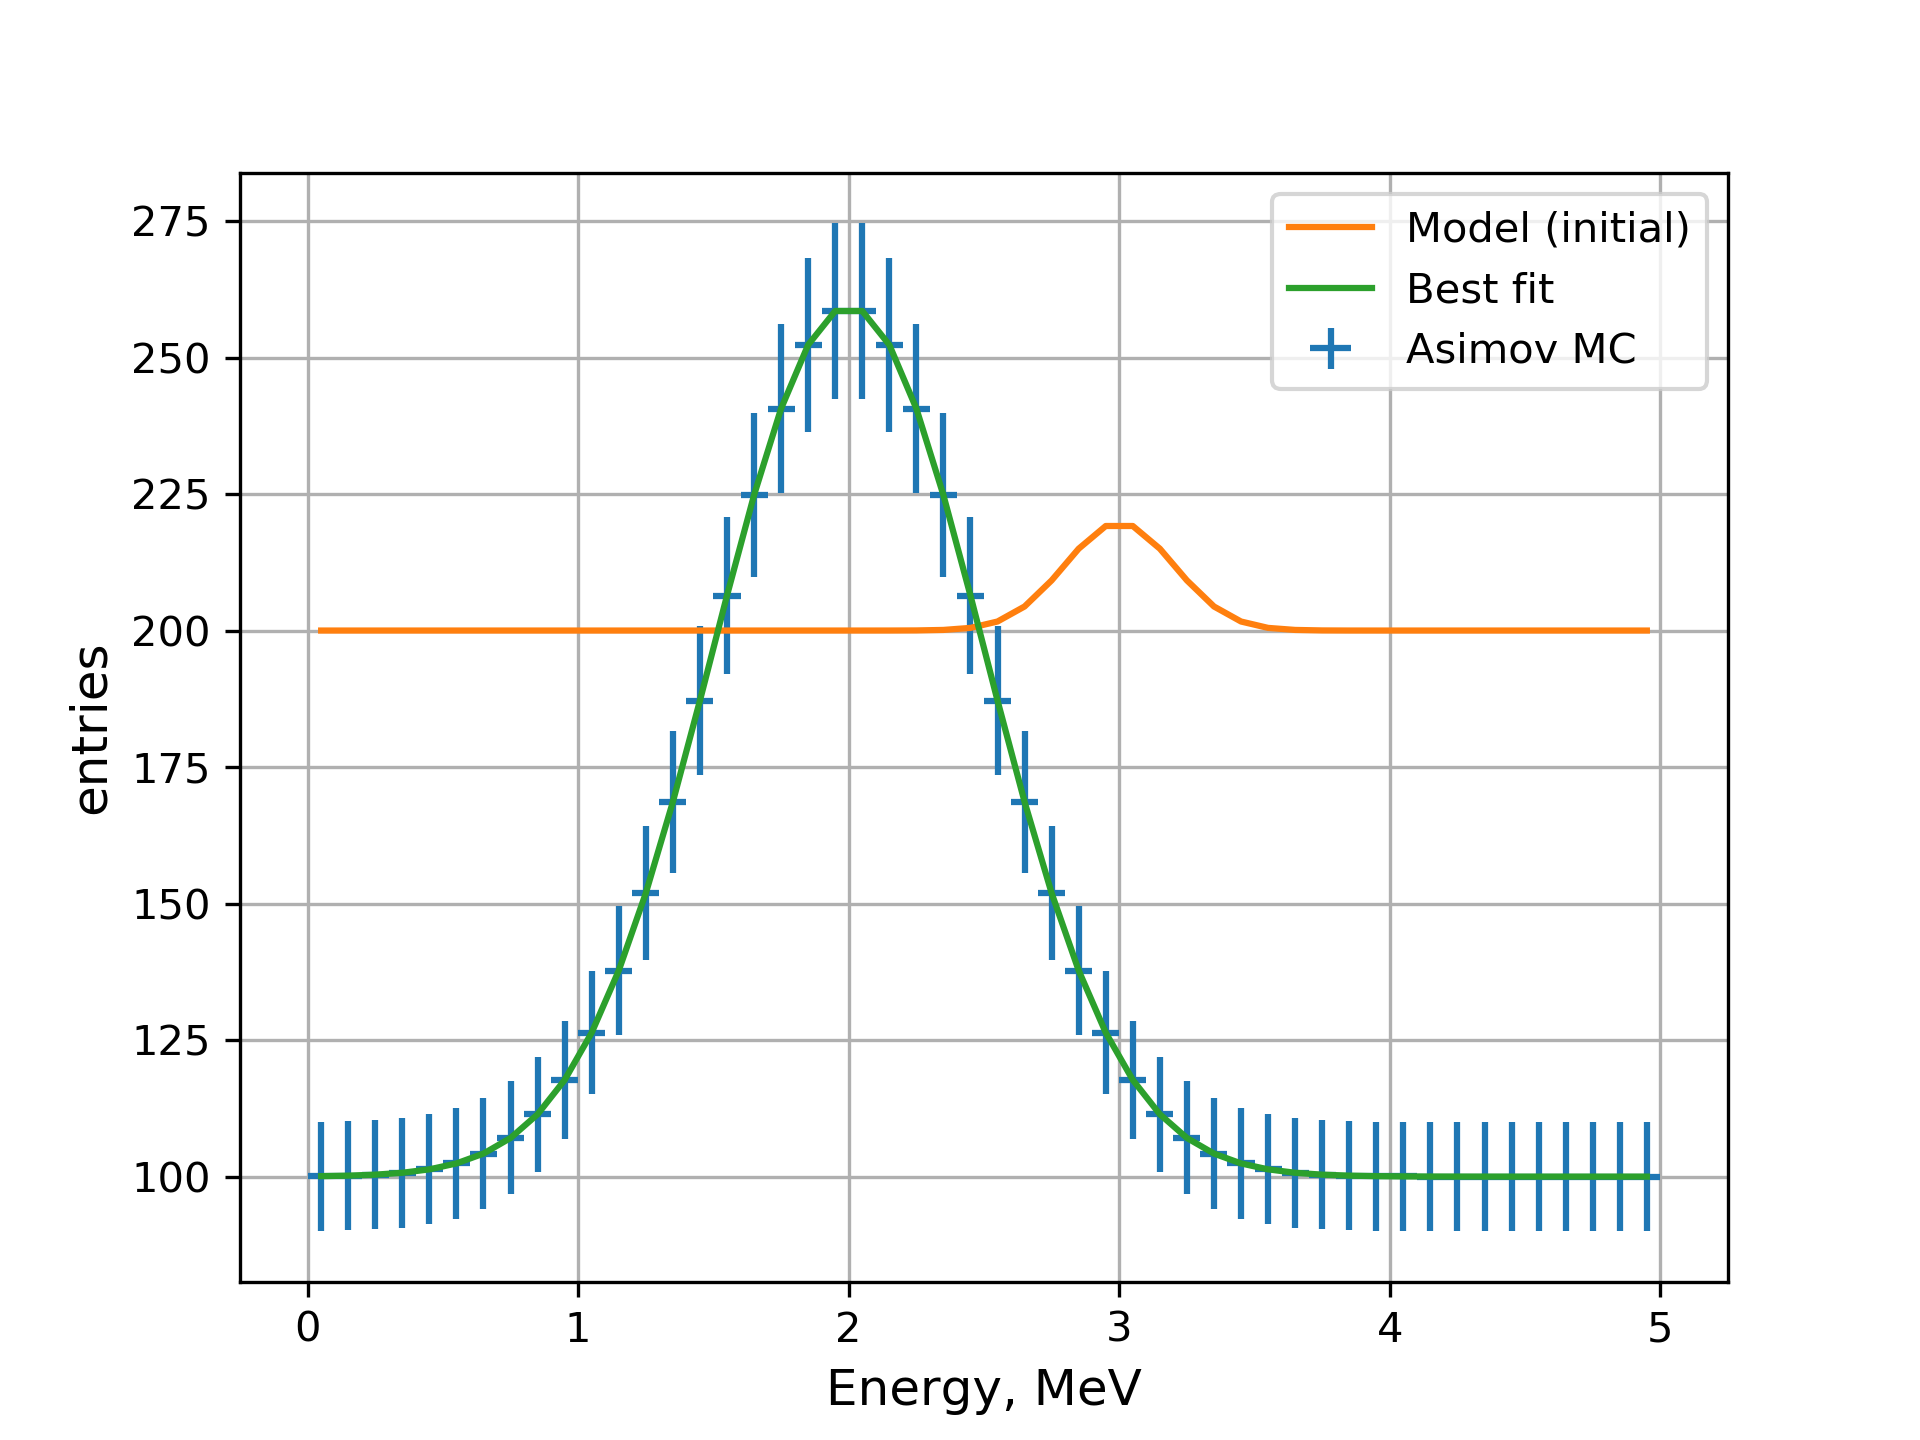
MC data defined by the model peak/spectrum_MC, initial and best fit state of the model peak/spectrum.
 1Fit result:${
 2  cpu : 0.0237910239957273,
 3  errors : [21.044786843888083, 89.87411551001028, 0.019925689550693886, 0.021573688772678953],
 4  errorsdict : ${
 5    peak : ${
 6      BackgroundRate : 21.044786843888083,
 7      E0 : 0.019925689550693886,
 8      Mu : 89.87411551001028,
 9      Width : 0.021573688772678953,
10    },
11  },
12  fun : 4.6533546220329065e-08,
13  maxcv : 0.01,
14  names : ['peak.BackgroundRate', 'peak.Mu', 'peak.E0', 'peak.Width'],
15  nfev : 166,
16  npars : 4,
17  success : True,
18  wall : 0.023801803588867188,
19  x : [1000.000584000211, 1999.989446718792, 2.0000031405938894, 0.4999998136336317],
20  xdict : ${
21    peak : ${
22      BackgroundRate : 1000.000584000211,
23      E0 : 2.0000031405938894,
24      Mu : 1999.989446718792,
25      Width : 0.4999998136336317,
26    },
27  },
28}
The full graph of this setup is presented below. The nodes for Asimov MC and statistical errors are shown with dashed borders which indicates that their data is frozen after being read and will not be updated when minimizer will change the model parameters.
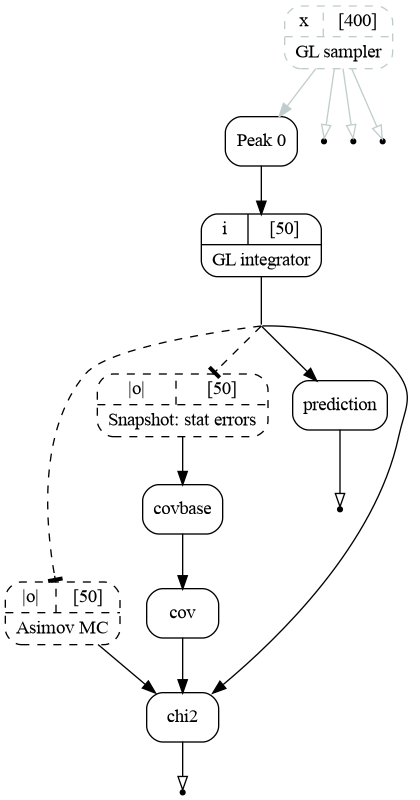
The computational graph used to fit the current model.