4.3. Plotting outputs in 3d: 2d histograms
4.3.1. 2d histograms
2d histograms as in example may be plotted in 3d. Three methods are provided for this purpose. All the methods support the same extra options as matshow.
4.3.1.1. Surface
The method plot_surface is using
plot_surface(X, Y, Z, …)
matplotlib function passing output data as X, Y and Z.
 1import gna.constructors as C
 2import numpy as np
 3from gna.bindings import common
 4from matplotlib import pyplot as plt
 5# Create numpy array for data points
 6xmin, ymin = 10, 20
 7nbinsx, nbinsy = 40, 50
 8edgesx = np.linspace(xmin, xmin+nbinsx*0.5, nbinsx+1)**2
 9edgesy = np.linspace(ymin, ymin+nbinsy*0.5, nbinsy+1)**0.25
10# Create fake data array
11cx = (edgesx[1:] + edgesx[:-1])*0.5
12cy = (edgesy[1:] + edgesy[:-1])*0.5
13X, Y = np.meshgrid(cx, cy, indexing='ij')
14narray = np.exp(-0.5*(X-cx[15])**2/150.0**2 - 0.5*(Y-cy[20])**2/0.10**2)
15
16# Create a histogram instance with data, stored in `narray`
17# and edges, stored in `edges`
18hist = C.Histogram2d(edgesx, edgesy, narray)
19
20from mpl_toolkits.mplot3d import Axes3D
21
22fig = plt.figure()
23ax = plt.subplot( 111, projection='3d' )
24ax.set_title( 'surface' )
25ax.minorticks_on()
26ax.set_xlabel( 'x label' )
27ax.set_ylabel( 'y label' )
28
29hist.hist.hist.plot_surface(cmap='viridis', colorbar=True)
30
31plt.show()
In order the surface was colorized cmap option should be passed with a valid colormap name (use viridis).

2d histogram, plotted via plot_surface() method.
Note
Note that mplot3d toolkit should be used (line 20) and the projection='3d' option should be set for a
subplot (line 23).
4.3.1.2. 3d bars
The method plot_bar3d is using
bar3d(X, Y, Z, dX, dY, dZ, …)
matplotlib function passing output data as X, Y, Z, dX, dY, dZ.
By default the bars are not colorized: cmap=True may be used to colorize the bars with default colormap.
1hist.hist.hist.plot_bar3d(cmap=True, colorbar=True)

2d histogram, plotted via plot_bar3d() method.
4.3.1.3. Wireframe
The method plot_wireframe is using
plot_wireframe(X, Y, Z, …)
matplotlib function passing output data as X, Y, and Z.
By default wire frame is not colorized: cmap=True may be used to colorize the wires with default colormap.
1hist.hist.hist.plot_wireframe(cmap=True, colorbar=True)
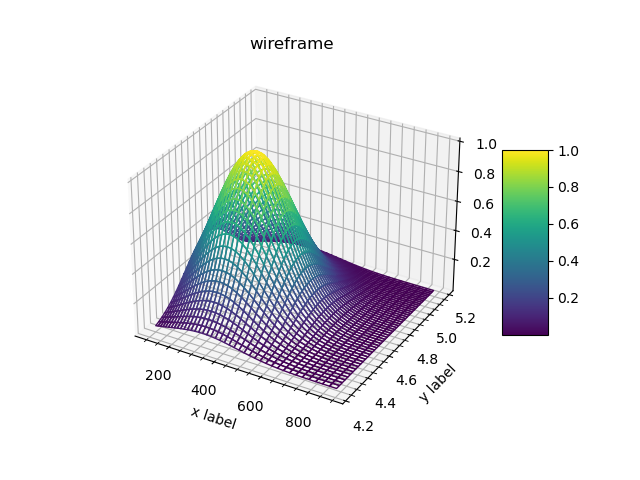
2d histogram, plotted via plot_wireframe() method.