10.3. Introducing new experiments
From the point of view of GNA command line user interface and experiment is just an UI module, that announces the outputs within common environment. In order to separate the experiments from regular UI modules they are loaded via a dedicated UI module exp:
./gna -- exp --help
The experiment implementations are expected to be located in on of the experimentpaths, defined in config/gna/gnacfg.py file. The default configuration may be overridden, see the experimentpaths example from bundles tutorial.
Let us now use the tutorial path for our experimentpaths and define a new experiment.
mkdir -p config_local/gna
echo "experimentpaths = ['./macro/tutorial/ui/experiments']" >> config_local/gna/gnacfg.py
The command ./gna -- exp -L will now print the list of available experiments:
Loading config file: config/gna/gnacfg.py
Loading config file: config_local/gna/gnacfg.py
Search paths:  ./macro/tutorial/ui/experiments
UI exp list of experiments:
    exampleexp
As one can see from the output, GNA has read the user configuration file. The path to search for the experiments points to the tutorial and there is only one experiment defined: exampleexp. This corresponds to the file ./macro/tutorial/ui/experiments/exampleexp.py.
We will now introduce a simple model, similar to gaussianpeak, but simpler. The model will contain flat background and a single Gaussian peak without integration. We will not define the default values for parameters, therefore they are expected to be provided from the command line.
Here is the code:
 1from gna import constructors as C
 2import ROOT as R
 3import numpy as np
 4
 5class exp(baseexp):
 6    def __init__(self, namespace, opts):
 7        baseexp.__init__(self, namespace, opts)
 8
 9    def init(self):
10        self.build()
11        self.register()
12
13    @classmethod
14    def initparser(cls, parser, namespace):
15        parser.add_argument('-r', '--range',  default=(0.0, 10.0), type=float, nargs=2, help='Energy range')
16        parser.add_argument('-N', '--points', default=200, type=int, help='Number of points')
17        parser.add_argument('-n', '--name',   default='peak', help='observable name')
18
19    def build(self):
20        locns = self.namespace
21        for name in ['BackgroundRate', 'Mu', 'E0', 'Width']:
22            if not name in locns:
23                locns.printparameters(labels=True)
24                raise Exception('Paramter {name} not found in namespace'.format(name=name))
25
26        self.points = C.Points(np.linspace(*self.opts.range, num=self.opts.points))
27        self.model = C.GaussianPeakWithBackground(labels='Gaussian peak')
28        self.points.points.points >> self.model.rate.E
29
30    def register(self):
31        self.namespace.addobservable('x', self.points.points.points)
32        self.namespace.addobservable(self.opts.name, self.model.rate.rate)
Let us go through it method by method. First of all, the experiment definition should contain a class exp that inherits from gna.exp.baseexp. Class initializer has two arguments local namespace and command line options:
1    def __init__(self, namespace, opts):
2        baseexp.__init__(self, namespace, opts)
3
4    def init(self):
5        self.build()
6        self.register()
7
Both arguments should be passed to the parent class initializer. Afterwards the user may do whatever he wants to define the experiment. We split this work in two methods: exp.build() to build the model and exp.register() to register the outputs in the environment.
The namespace and the options are available as class members self.namespace and self.opts. Before working on actual implementation we need to define the command line parsing options.
In order to define the command line parsing behaviour the user must define class method initparser(parser,namespace).
1    def initparser(cls, parser, namespace):
2        parser.add_argument('-r', '--range',  default=(0.0, 10.0), type=float, nargs=2, help='Energy range')
3        parser.add_argument('-N', '--points', default=200, type=int, help='Number of points')
4        parser.add_argument('-n', '--name',   default='peak', help='observable name')
5
The parser is an instance of the Argparser python module. See Argparser documentation for reference. The basic syntax is quite self explanatory. Within three lines 3-5 we define:
Option
-ror--rangeexpecting two arguments that will be converted to float. The provided value will be available as self.opts.range. In case nothing is provided the value will be set to (0.0, 10.0).Option
-Nor--pointsexpecting one argument that will be converted to integer. The provided value will be available as self.opts.points. In case nothing is provided the value will be set to 200.Option
-nor--nameexpecting one argument (string). The provided value will be available as self.opts.name. In case nothing is provided the value will be set to peak.
The option range defines the energy range, points defines the number of points over X axis and name defines the observable name.
As soon as proper help lines are specified, one may get the documented help with the ./gna -- exp --help exampleexp
command:
usage: gna -- exp exampleexp [-h] [-r RANGE RANGE] [-N POINTS] [-n NAME]

optional arguments:
  -h, --help            show this help message and exit
  -r RANGE RANGE, --range RANGE RANGE
                        Energy range
  -N POINTS, --points POINTS
                        Number of points
  -n NAME, --name NAME  observable name
The actual computational chain is defined in the build() method.
 1        locns = self.namespace
 2        for name in ['BackgroundRate', 'Mu', 'E0', 'Width']:
 3            if not name in locns:
 4                locns.printparameters(labels=True)
 5                raise Exception('Paramter {name} not found in namespace'.format(name=name))
 6
 7        self.points = C.Points(np.linspace(*self.opts.range, num=self.opts.points))
 8        self.model = C.GaussianPeakWithBackground(labels='Gaussian peak')
 9        self.points.points.points >> self.model.rate.E
10
First half checks that all the necessary variables are present in the namespace. Than we define energy axis as instance of Points. The energy array is then bound to the input of the GaussianPeakWithBackground instance. When module exp loads the experiment definition it ensures that exp.namespace is set as default namespace to search for parameters.
And the last method adds the outputs as observables to the current namespace: x and peak:
1        self.namespace.addobservable('x', self.points.points.points)
2        self.namespace.addobservable(self.opts.name, self.model.rate.rate)
As the namespace is shared across the modules, the observables are accessible for other commands, including plot-spectrum, minimizer or fit.
Let us now define the parameters and execute the module.
./gna -- ns \
            --define BackgroundRate central=5 fixed=True label='Background rate' \
            --define E0             central=6 fixed=True label='Peak position' \
            --define Width          central=1 fixed=True label='Peak width' \
            --define Mu             central=5 fixed=True label='Signal rate' \
        -- exp exampleexp --range 0 10 -N 100
The command output reflects the fact, that the outputs were registered:
Add observable: /x
Add observable: /peak
We now may plot the provided model with plot-spectrum module. The only change we do is that we place the variables and
the outputs to the nested namespace peak. In order to achieve this we are using ns --name and exp --ns
options.
Unlike in case of histograms, the output does not contain the information about the X axis, therefore a special option
--vs
./gna -- ns --name peak -p \
                --define BackgroundRate central=5 fixed=True label='Background rate' \
                --define E0             central=6 fixed=True label='Peak position' \
                --define Width          central=1 fixed=True label='Peak width' \
                --define Mu             central=5 fixed=True label='Signal rate' \
          -- exp --ns peak exampleexp --range 0 10 -N 100 \
          -- plot-spectrum -p peak/peak --vs peak/x \
          -- mpl -t 'Gaussian Peak' --xlabel 'Energy, MeV' --ylabel '$dN/dE$' \
                           --grid -s
The output of the command is:
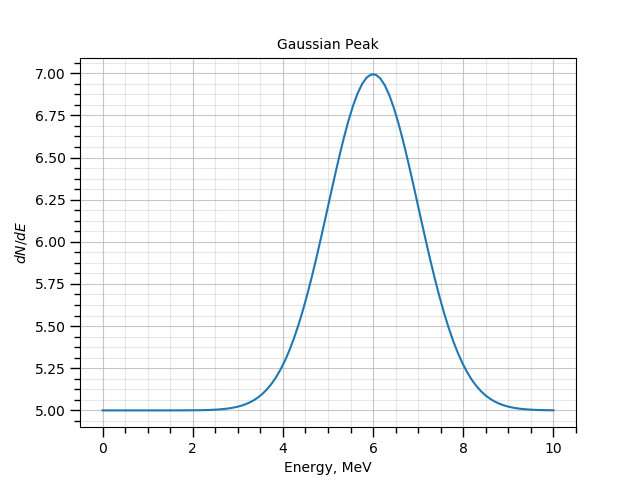
The model, defined by the exampleexp exp module.
Important
Good practise is to work on your own models and experiments in a restricted environment, i.e. in a separate folder added to the experimentpaths configuration variable.